Data Science Projects
Perfume Visualizations
After scraping data from a perfume review site, I created an interactive PowerBI dashboard that breaks down perfume notes and performs sentiment analysis based on the fragrance reviews. This becomes a quick tool to help you find your next favorite fragrance!
Computer Vision for Camera Trap Images
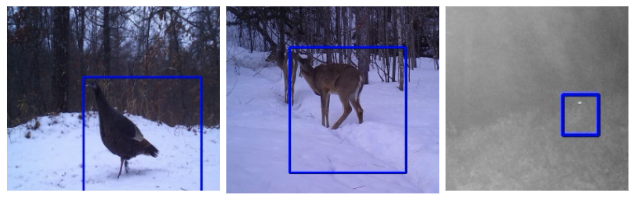
We developed Caminos, our deep learning system that predicts both the animal species and the count of animals caught on trail camera images. Our methodology uses an ensemble approach that consists of both object detection and classification algorithms: YOLOv5, EfficientNet, and MegaDetector. These predictions are then supplied as recommendations to users as they label images in our custom-built annotation tool. Caminos streamlines the annotation process for users, resulting in much faster annotation times and providing a valuable resource and blueprint to accelerate conservation decision-making.
Our system was able to correctly identify the animal species with 83% accuracy, and was able to achieve 94% accuracy when the model predicts the correct species within its top three most likely classifications. The model was also able to correctly predict the number of animals in the image with 78% accuracy.
Multi-Document Summarization - NLP
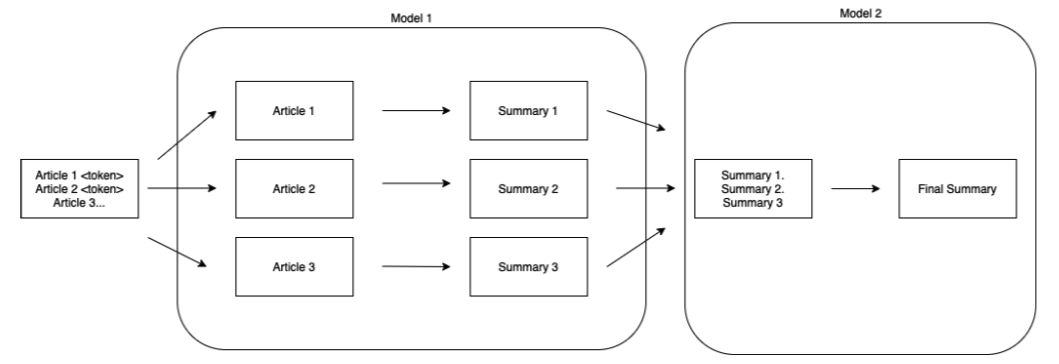
We experiment with multi-document summarization using a two-stage transformer pipeline consisting of both extractive and abstractive steps on the Multi-News dataset. We found that an ensemble approach of abstractive-abstractive models yielded the best results of any of our full self-attention implementations. However, we still observed issues concerning the quality of generated summaries, namely that our summaries inferred new vocabulary that was not present in the training data.
Air Traffic Departure Delay Prediction
In this exercise of predicting airport departure delays, we explore airline data, engineer features, and perform model selection. We found that creating new features that corresponded to airport delay state or tail number delay state led to the greatest performance gains. We found that the following features were most predictive of departure delays:
- PRIOR_DEL15 (binary variable) - indicates if there was a prior delay of at least 15 minutes during a time window starting eight hours before scheduled departure and ending two hours before scheduled departure time.
- PRIOR_DEP_DELAY (minutes) - same definition as above the the variable is expressed in minutes
- AVG_ORIGIN_DELAY (minutes) - indicates the average delay in minutes of the origin airport occurring between three and two hours prior to a flight’s scheduled departure time
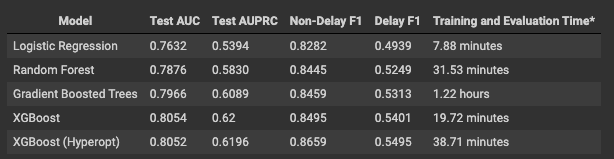
The final model selected was an XGBoost model trained on a dataset consisting of all flights occurring from 2015-2018 and evaluated on a test set containing 2019 flights. Delay F1 Score was 0.5495 and Non-Delay F1 Score was 0.8659. Since the dataset was heavily imbalanced, with non-delays outnumbering delays by approximately a 5:1 ratio, we also evaluated against Area Under Precision Recall Curve (AUPRC), which takes into account of precision and recall of the positive class. AUPRC was 0.62.
Effect of Learning Feedback Styles on Learning Outcomes
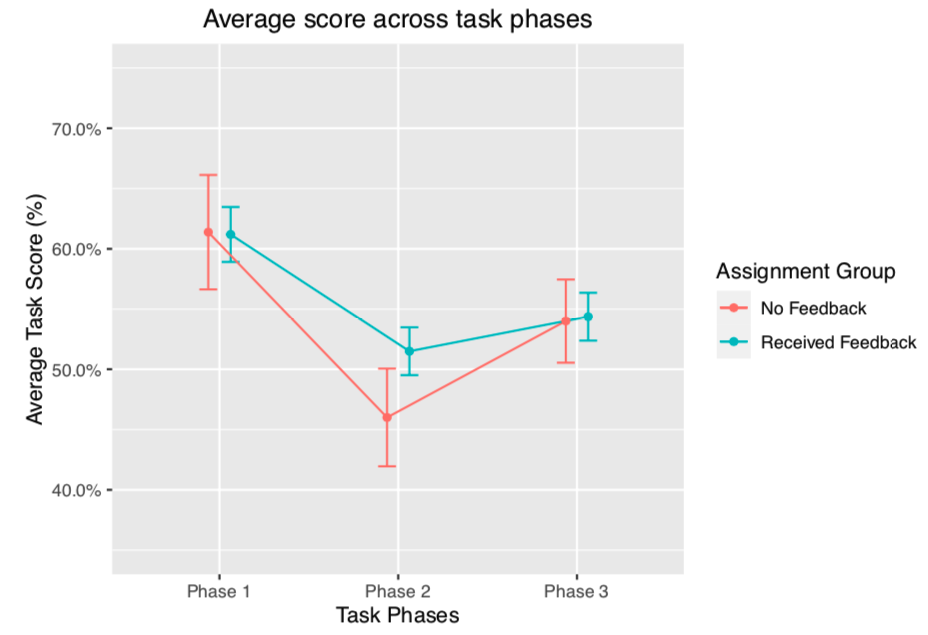
Feedback interventions are pervasive to professional environments. The aim of this study is to assess the effectiveness of different types of feedback. We use a controlled experiment and ask subjects to classify X-Ray images for healthy or penumonia-sick lungs. 333 participants recruited on Amazon’s Mechanical Turk analyzed three sets of X-Ray lung images on an online survey. After a pre-treatment test, participants are randomly assigned to five different feedback groups (one control and four types of feedback) and received feedback in between each set of X-Ray images (twice in total).
We found that expert-driven feedback was statistically significant and led to some of the highest improvements in X-Ray analysis. Furthermore, self-reflective feedback techniques were shown to be just as significant and effective. In quick, recognition-based tasks, focusing on negative feedback (i.e. what is wrong) may not be an effective strategy to improve performance. We also found that the marginal improvements in scores from a second feedback session are not significant and may not be worthwhile for shorter duration jobs. Lastly, feedback was found to be more impactful for low achieving performers. High performers do not exhibit any increased boost from feedback and may have been just as successful regardless of feedback sessions.
Diagnosing Pneumonia from Chest X-Rays
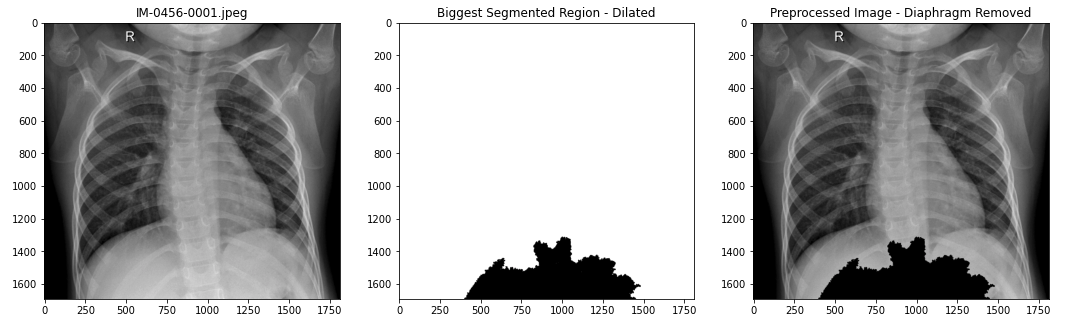
Using convolutional neural networks, we attempt to create a multi-class classifier that would be able to identify whether a given image of a chest x-ray is normal or has bacterial or viral pneumonia. Based on a Kaggle dataset provided by Paul Mooney, we utilize preprocessing techniques to remove the diaphragm from the original x-ray images. This is because the diaphragm region in x-ray images are usually regions with the brightest pixels. Removing these high-intensity white areas may have a positive effect in distinguishing potential patterns of pneumonia in the lung areas. We’ve uploaded the preprocessed images into a new Kaggle dataset here. Using ensemble techniques with pre-trained architectures, we were able to achieve approximately 89% test accuracy.
Case Study: Is there a relationship between playground availability and household income in New York City?
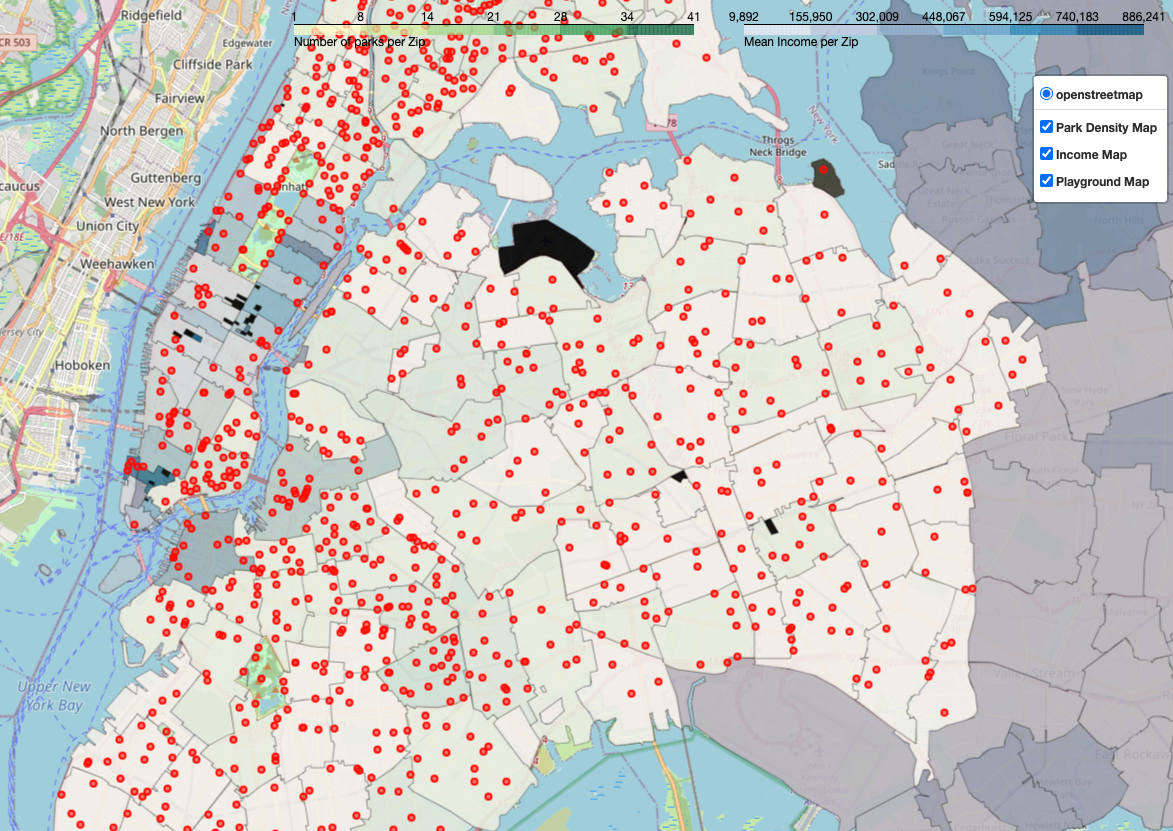
Using datasets provided by the IRS and NYC Open Data, I attempt to investigate whether household income has any relationship with playground and park availability in New York City. Using the folium library, I create an interactive map with multiple overlays illustrating the distribution of income, playgrounds, and park density according to zip codes.
 NYC Playground-Income Interactive Map
San Francisco Bike Sharing Analysis
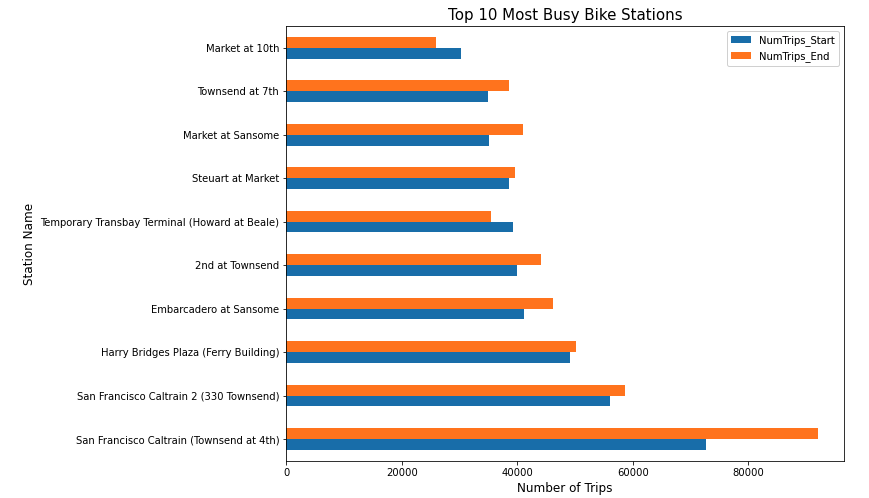
Using Google BigQuery public datasets, I perform some exploratory analysis into Lyft’s BayWheels Bikesharing Program. Afterwards, I describe some business recommendations that could be used to improve the service.